Oura, Whoop, Apple Watch: what your sleep and HRV data are worth in a consultation
Deep sleep minutes, HRV and recovery scores sit on most patients' phones. Here is which of those numbers are measurement-grade, which are not, and how we still use the data clinically.
"I've only been getting 42 minutes of deep sleep for weeks." We hear this regularly, usually accompanied by a screenshot with a red bar on it. Sometimes a second sentence follows: "And I actually feel fine."
Both statements can be true. Wearables generate several hundred data points every night, and the quality of those points varies enormously. Some numbers from a ring or a watch are useful for a clinical assessment. Others are estimates with an error range wider than the difference under discussion.
This article sorts through that: what the devices physically measure, how the derived values perform against laboratory measurement, and how we still put the data to work over time.
What the devices actually measure
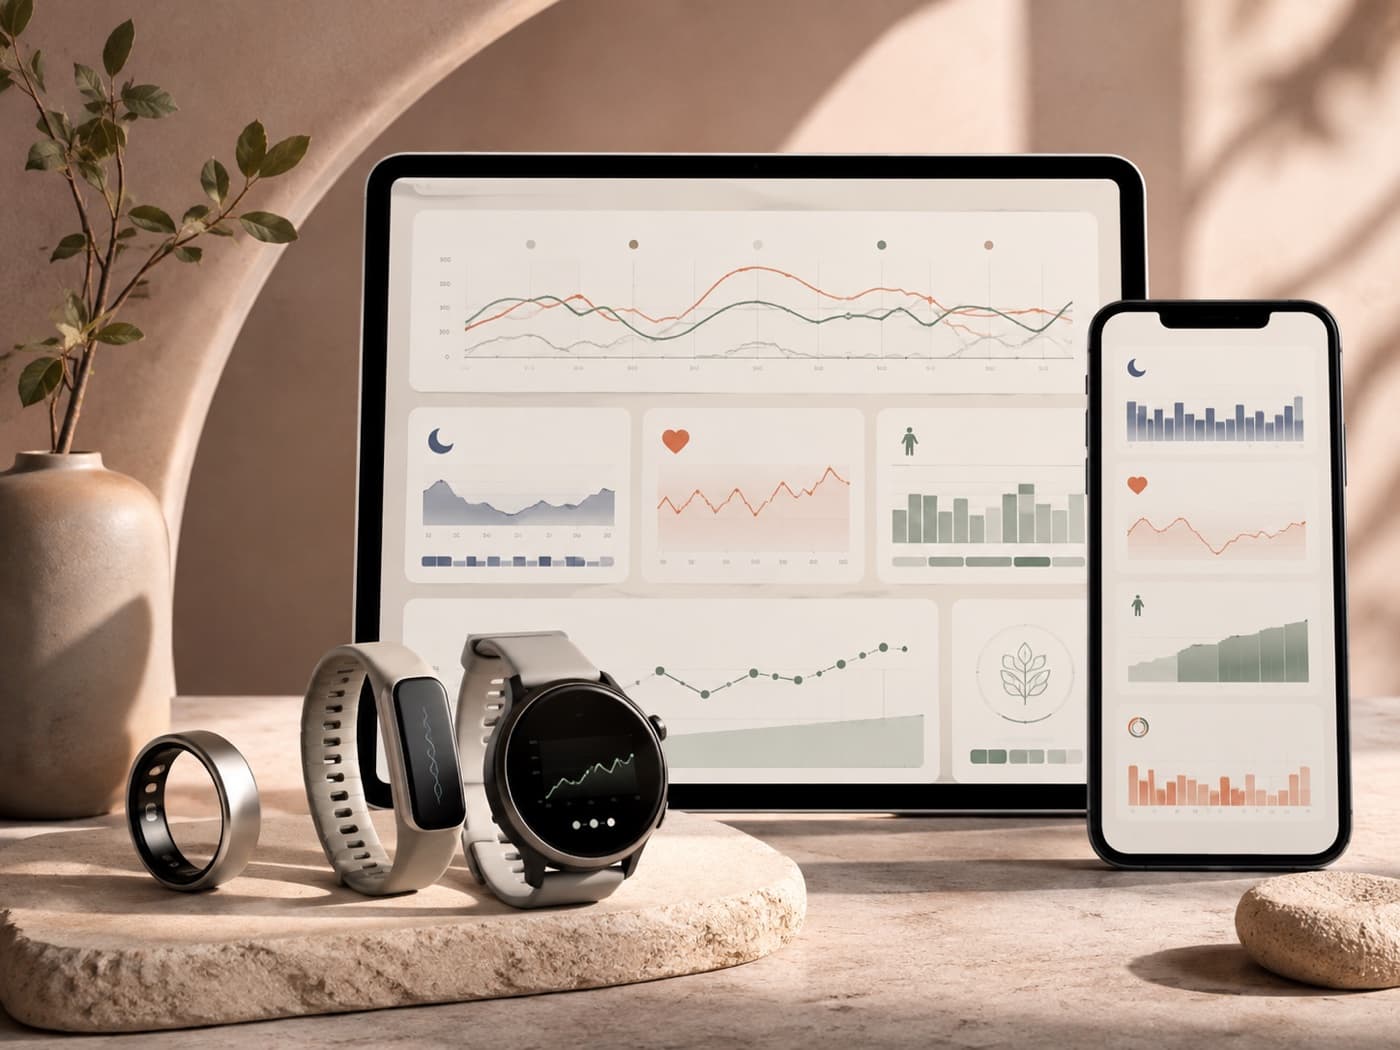
A ring or a watch has essentially three sensors: photoplethysmography (PPG), an accelerometer, and a skin temperature sensor.
PPG shines LEDs into tissue and measures how much light returns. Each heartbeat changes the blood volume in the capillary bed, which produces a pulse waveform. The accelerometer captures movement. The temperature sensor captures skin temperature at one point.
Everything else is computation. Sleep stages, HRV, recovery score, readiness, strain and sleep quality are model outputs that an algorithm derives from those three raw signals. Their quality depends on how well the model matches physiology and how clean the raw signal is.
In short
- What is measured directly: pulse waveform, movement, skin temperature.
- Sleep stages, HRV values and scores are derived quantities from an algorithm.
- Accuracy differs substantially between those categories.
Sleep: solid on whether, weak on how
The best independent comparison tested seven devices against polysomnography, the laboratory standard with EEG, eye and muscle recording (Chinoy et al., Sleep, 2021). Per 30-second epoch, sensitivity for sleep reached at least 0.93 on every device. Specificity for wake landed at 0.18 to 0.54.
That is the central finding. The devices reliably detect that you are asleep. Wake periods in bed they detect poorly, frequently logging them as sleep. Total sleep time bias ranged from −0.3 to +46.8 minutes.
A meta-analysis of 24 studies covering 798 participants and twelve devices (Lee et al., Journal of Clinical Sleep Medicine, 2025) quantifies the pooled differences against polysomnography: total sleep time −16.85 minutes, wake after sleep onset +13.26 minutes, sleep efficiency −4.69 percent.
Sleep stages are where it gets starker. An independent evaluation of five devices (Kainec et al., Sensors, 2024) found a mean absolute percentage error of 59 to 139 percent for wake after sleep onset. Devices overestimated wake on quiet nights and underestimated it on restless ones. A comparison of six devices against polysomnography (Miller et al., Sensors, 2022) found four-stage agreement of 50 to 65 percent (κ 0.25 to 0.52). Even the best device disagreed with the laboratory on roughly a third of epochs.
Oura Gen 3 with the OSSA 2.0 algorithm reports better figures: 91.7 percent accuracy for sleep versus wake and 90.6 percent for REM across 421,045 epochs (Svensson et al., Sleep Medicine, 2024). Two things belong alongside that: the study was conducted with Oura Health involvement, and a published methodological critique of it exists.
In short
- Sleep duration and sleep timing are usable, with a typical error in the region of a quarter of an hour.
- Wake periods in bed are systematically underestimated.
- Deep sleep and REM minutes are estimates with a wide error band and do not function as measurements.
That third line has an uncomfortable consequence. The people who lie awake at night are often the ones whose device tells them they slept well.
HRV: the number says almost nothing, the trend says something
Heart rate variability describes the fluctuation in intervals between consecutive heartbeats. The metric most wearables use is rMSSD, which predominantly reflects vagal, parasympathetic activity (Laborde et al., Frontiers in Psychology, 2017).
Two hard constraints limit what a single value can tell you.
First, the spread among healthy people. A synthesis of 44 studies covering 21,438 healthy adults (Shaffer & Ginsberg, Frontiers in Public Health, 2017) gives a mean rMSSD of 42 ms with a range of 19 to 75 ms, and SDNN of 50 ms across 32 to 93 ms. An rMSSD of 28 ms sits comfortably in the healthy range, and so does one of 70 ms. The same paper states that 24-hour, short-term and ultra-short-term values are not interchangeable, which means an overnight ring value cannot be held against published reference ranges either.
Second, the measurement accuracy of the devices. The comparison study cited above (Miller et al., 2022) tested overnight rMSSD against ECG:
| Device | rMSSD bias | Absolute bias | ICC |
|---|---|---|---|
| Apple Watch S6 | −9.6 ms | 22.5 ms | 0.67 |
| Garmin Forerunner 245 | −22.4 ms | 33.1 ms | 0.24 |
| Polar Vantage V | −8.7 ms | 18.8 ms | 0.65 |
| Oura Ring Gen 2 | −10.2 ms | 18.9 ms | 0.63 |
| Whoop 3.0 | −4.5 ms | 4.7 ms | 0.99 |
Heart rate itself was accurate on most devices, with absolute biases of 0.7 to 5.4 beats per minute. For rMSSD the errors are an order of magnitude larger. A bias of 10 to 22 ms against a healthy range spanning 19 to 75 ms explains why comparing your HRV with a training partner's yields nothing usable. For context: this study was funded by the Australian Institute of Sport, the authors disclose research support from Whoop Inc., and Whoop performed best.
A meta-analysis of PPG-derived pulse rate variability (Xu et al., Sensors, 2026) shows that agreement with ECG is good under controlled resting conditions. The authors state explicitly that these results should not be generalised to sleep, exercise, stress or free-living settings. Those are precisely the conditions wearables operate in.
What remains is the trend. Sports science has worked with averaged weekly values rather than single measurements for years, because single values fluctuate too much (Plews et al., Sports Medicine, 2013). A seven-day average falling across three weeks is a signal worth following up. A single night's value stays outside that picture.
In short
- The healthy range for rMSSD spans roughly four-fold, so comparing across people is worthless.
- Device error sits in the same order of magnitude as genuine biological differences.
- What is usable: the change in your own averaged value over weeks.
For a trend worth trusting, keep the conditions constant: same position, no caffeine for at least two hours beforehand, no alcohol for 24 hours, and no hard session the previous evening that goes unrecorded (Laborde et al., 2017).
Where the data has real clinical value
The criticism above concerns the precision of individual values. The usefulness lies elsewhere.
Behaviour change. An umbrella review of 39 systematic reviews covering 163,992 participants (Ferguson et al., The Lancet Digital Health, 2022) found that activity trackers produced roughly 1,800 additional steps per day, around 40 minutes more walking, and about one kilogram of weight reduction. For blood pressure, cholesterol and HbA1c, effects were "typically small and often non-significant." That is the honest picture: the devices measurably change behaviour, and the biomarkers do not automatically follow.
Making regularity visible. The most reliable number from a wearable is the time you go to bed. A two-and-a-half-hour spread across the week often explains more in a consultation than any deep sleep figure.
Catching physiological shifts early. In a Stanford cohort, 26 of 32 COVID-19 cases showed changes in heart rate, step count or sleep, with 22 of 25 analysable cases detected at or before symptom onset (Mishra et al., Nature Biomedical Engineering, 2020). That was a retrospective analysis with no reported false-positive rate, so it is not a validated screening test. As a demonstration that physiological change shows up in the data, it remains notable.
Resting heart rate and atrial fibrillation. Resting heart rate across weeks is among the more robust quantities. For rhythm disturbances, the EHRA practical guide (Svennberg et al., EP Europace, 2022) distinguishes ECG-based from PPG-based functions and holds that clinician overreading of the recording remains necessary in every case.
A risk we take seriously
In 2017, Baron and colleagues coined the term orthosomnia in the Journal of Clinical Sleep Medicine: a case series of patients seeking help for self-diagnosed sleep disturbance, triggered by tracker reports of light or restless sleep. The authors describe how the data can become a perfectionistic quest for ideal sleep, and how patients may distrust a clinical assessment that contradicts the device.
Worrying about the sleep score lengthens sleep latency. The device's error in detecting wakefulness compounds it. When the data itself becomes the burden, a tracking break belongs among the therapeutic options.
Regulatory context
The Apple Watch ECG app and irregular rhythm notification are CE-marked medical device functions in the European Economic Area (Apple, 2019). The pivotal trial of roughly 600 participants against a 12-lead ECG produced 98.3 percent sensitivity for atrial fibrillation and 99.6 percent specificity for sinus rhythm, with 87.8 percent of recordings classifiable at all. The remaining twelve percent belongs in the figure.
Oura and Whoop market their sleep, readiness and recovery outputs as general wellness features. How actively that boundary is policed was visible in an FDA warning letter to Whoop in July 2025 concerning its blood pressure feature, in which the agency held that blood pressure estimation is not a low-risk wellness function. The matter was subsequently closed.
How we use the data in practice
If you bring your exports, we work through them in this order.
- Regularity first. Bedtimes and wake times across 30 to 90 days, including the weekend spread.
- Total sleep time as a weekly average. Individual nights stay out of it.
- Resting heart rate as a trend. A resting heart rate climbing over weeks at unchanged training load is a concrete reason to look further.
- HRV as a seven-day average against your own baseline. Absolute values and comparisons with other people stay out.
- Deep sleep and REM minutes stay out. Where there is a reasoned suspicion of sleep apnoea or another sleep disorder, we arrange diagnostics built for that purpose.
- Cross-check against labs and history. Where fatigue persists despite unremarkable tracker data, blood diagnostics is the next step.
Conclusion
Your wearable is a good behaviour sensor and a rough physiology sensor. Bedtimes, weekly average sleep duration, resting heart rate and activity are solid enough to inform a clinical assessment. Deep sleep minutes and a single night's HRV are not.
The most productive way to use them: treat the numbers as the starting point for a question to bring to us. If your data has been moving in one direction for weeks, or if you feel persistently exhausted despite good numbers, bring the exports to your first appointment. We go through them together and decide which measurement will actually answer the question.
References
- Chinoy ED, Cuellar JA, Huwa KE, et al. Performance of seven consumer sleep-tracking devices compared with polysomnography. Sleep. 2021;44(5):zsaa291. doi:10.1093/sleep/zsaa291
- Lee YJ, Lee JY, Cho JH, et al. Performance of consumer wrist-worn sleep tracking devices compared to polysomnography: a meta-analysis. Journal of Clinical Sleep Medicine. 2025;21(3):573–582. doi:10.5664/jcsm.11460
- Kainec KA, Caccavaro J, Barnes M, et al. Evaluating accuracy in five commercial sleep-tracking devices compared to research-grade actigraphy and polysomnography. Sensors. 2024;24(2):635. doi:10.3390/s24020635
- Miller DJ, Sargent C, Roach GD. A validation of six wearable devices for estimating sleep, heart rate and heart rate variability in healthy adults. Sensors. 2022;22(16):6317. doi:10.3390/s22166317
- Svensson T, Madhawa K, Hoang NT, et al. Validity and reliability of the Oura Ring Generation 3 with sleep staging algorithm 2.0 compared to multi-night ambulatory polysomnography. Sleep Medicine. 2024;115:251–263. doi:10.1016/j.sleep.2024.01.020
- Shaffer F, Ginsberg JP. An overview of heart rate variability metrics and norms. Frontiers in Public Health. 2017;5:258. doi:10.3389/fpubh.2017.00258
- Laborde S, Mosley E, Thayer JF. Heart rate variability and cardiac vagal tone in psychophysiological research. Frontiers in Psychology. 2017;8:213. doi:10.3389/fpsyg.2017.00213
- Task Force of the European Society of Cardiology and the North American Society of Pacing and Electrophysiology. Heart rate variability: standards of measurement, physiological interpretation, and clinical use. Circulation. 1996;93(5):1043–1065. doi:10.1161/01.CIR.93.5.1043
- Plews DJ, Laursen PB, Stanley J, et al. Training adaptation and heart rate variability in elite endurance athletes. Sports Medicine. 2013;43(9):773–781. doi:10.1007/s40279-013-0071-8
- Xu S, Liu H, Liu Z, et al. Accuracy of photoplethysmography-derived pulse rate variability compared with electrocardiography-derived heart rate variability: a systematic review and meta-analysis. Sensors. 2026;26(16):5192. doi:10.3390/s26165192
- Ferguson T, Olds T, Curtis R, et al. Effectiveness of wearable activity trackers to increase physical activity and improve health. The Lancet Digital Health. 2022;4(8):e615–e626. doi:10.1016/S2589-7500(22)00111-X
- Mishra T, Wang M, Metwally AA, et al. Pre-symptomatic detection of COVID-19 from smartwatch data. Nature Biomedical Engineering. 2020;4(12):1208–1220. doi:10.1038/s41551-020-00640-6
- Baron KG, Abbott S, Jao N, et al. Orthosomnia: are some patients taking the quantified self too far? Journal of Clinical Sleep Medicine. 2017;13(2):351–354. doi:10.5664/jcsm.6472
- Svennberg E, Tjong F, Goette A, et al. How to use digital devices to detect and manage arrhythmias: an EHRA practical guide. EP Europace. 2022;24(6):979–1005. doi:10.1093/europace/euac038
- Petek BJ, Al-Alusi MA, Moulson N, et al. Consumer wearable health and fitness technology in cardiovascular medicine: JACC state-of-the-art review. Journal of the American College of Cardiology. 2023;82(3):245–264. doi:10.1016/j.jacc.2023.04.054
- Apple Inc. ECG app and irregular rhythm notification on Apple Watch available today across Europe and Hong Kong. Apple Newsroom, 27 March 2019.
- US Food and Drug Administration. Warning Letter to Whoop, Inc., 14 July 2025, ref. 709755.

Consultation at Sustainable Med
60 minutes for your symptoms, existing results and the next clinical steps.
More from the Journal
Always tired: which blood tests provide useful answers
Which blood tests can help with persistent fatigue, what reference ranges mean and why medical interpretation matters.
Jan Okoye-Weeg
Biological age: what the tests measure and what your numbers actually tell you
Epigenetic age clocks deliver a memorable number. Here is how reliable it is at the individual level, and which markers really say something about your next decades.
Jan Okoye-Weeg